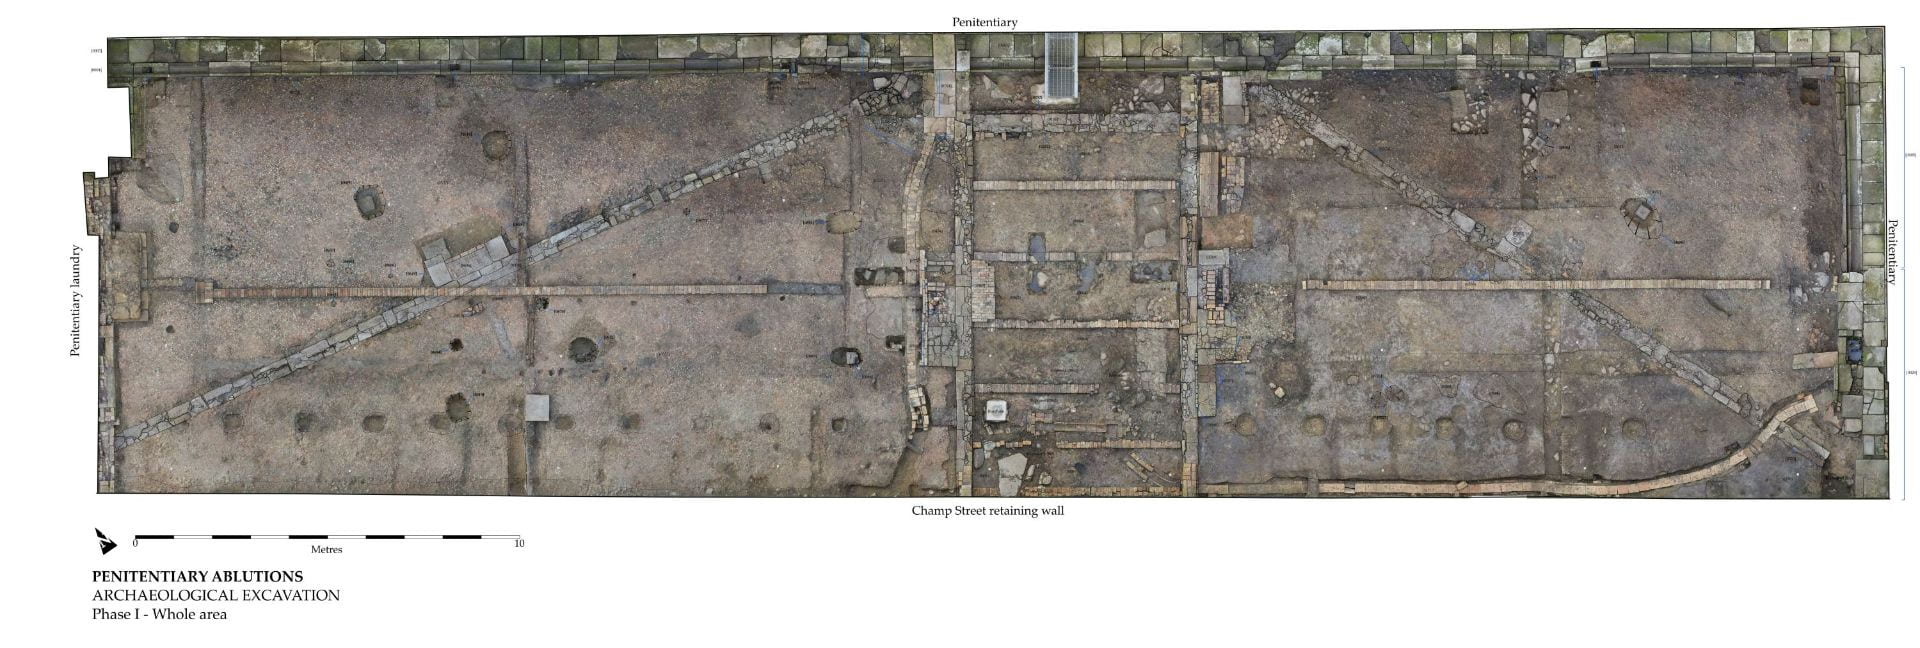
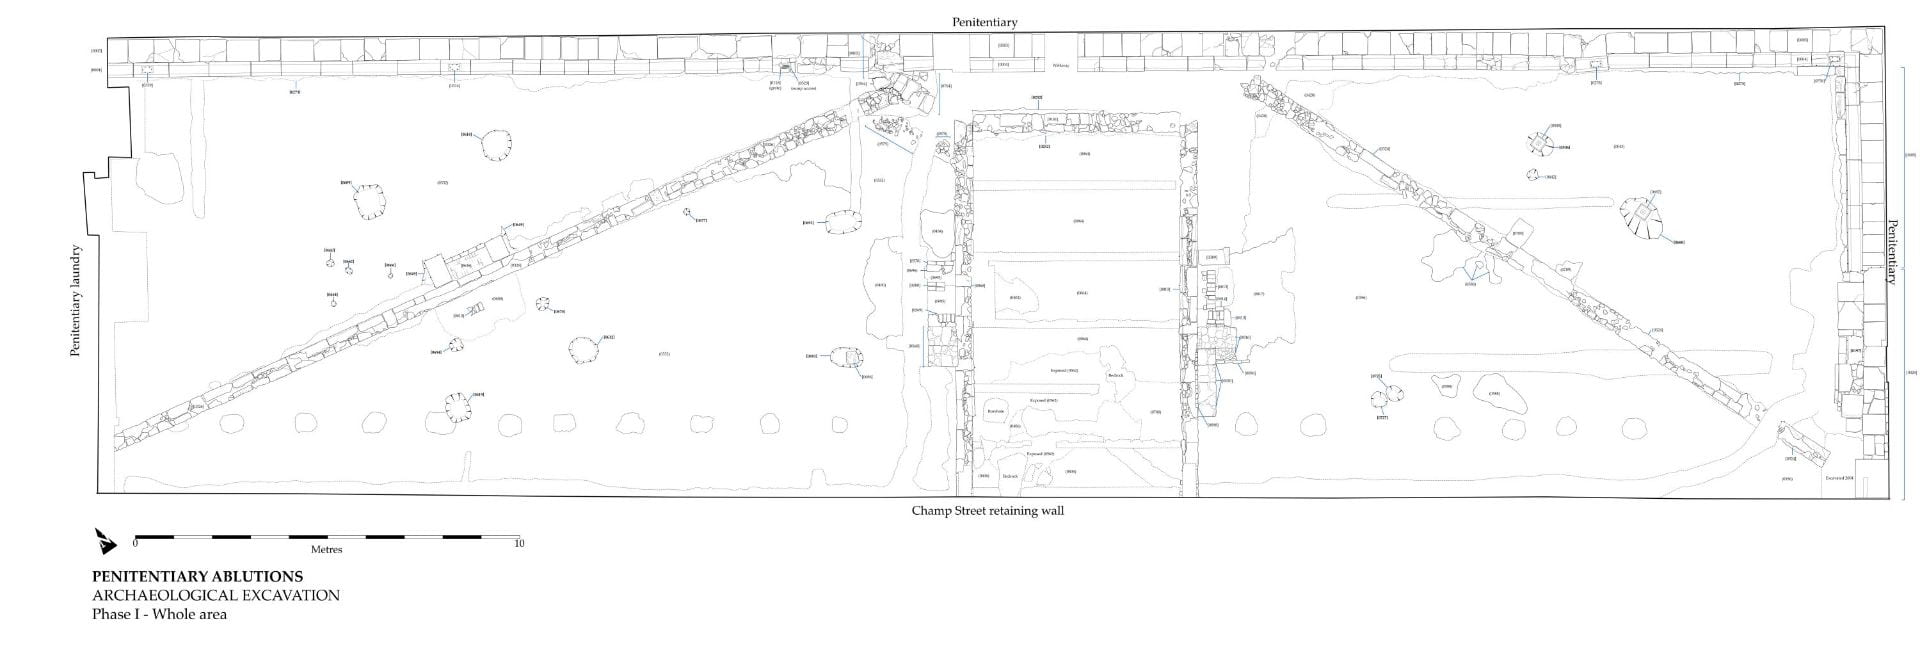
Though the site has been mothballed, the archaeology roadshow trundles on. Despite having only been on site for 12 days, we managed to generate a bit of data that has been keeping me busy. One key result has been the processing of our photogrammetry data. This is a super-high detail way of recording archaeological sites, that allows us to not only capture the site in 2D plan, but also 3D. Where formerly us archaeologists would spend hours, if not days, hand-planning sites – our little fingers often so cold that they could barely grip the 5h pencil – these days we take a series of carefully positioned photographs and feed it through a whizz-bang computer program. The end result is something that records the site in great detail (assisting reporting), provides a beautiful 3D model for interpretation and also provides the base from which we can produce lovely archaeological illustrations. The two illustrations below show some photogrammetry that we did in 2016, as part of the Penitentiary ablutions and laundry archaeological excavations. The photogrammetry was completed and processed by Photogammetry Master Peter Rigozzi, which I then used as a base for the illustration (below).
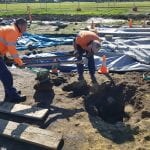
The first and most important step in this process is collecting the photographs. For this we use a DSLR camera mounted on a pole at least 3.5m above the area we are photographing. Two people then walk along transects (one person holding the pole, another operating the remote capture program running on a tablet). We make sure that every shot has at least 60% overlap. For the model of our site we took 440 photographs.
Then it’s into the office, where we fire up a nifty bit of kit called Agisoft Metashape. The first processing stage is running the photos through an alignment program. Below you can see the photogrammetry after all 440 images have been aligned. The position and orientation of each camera shot is marked by a blue square.

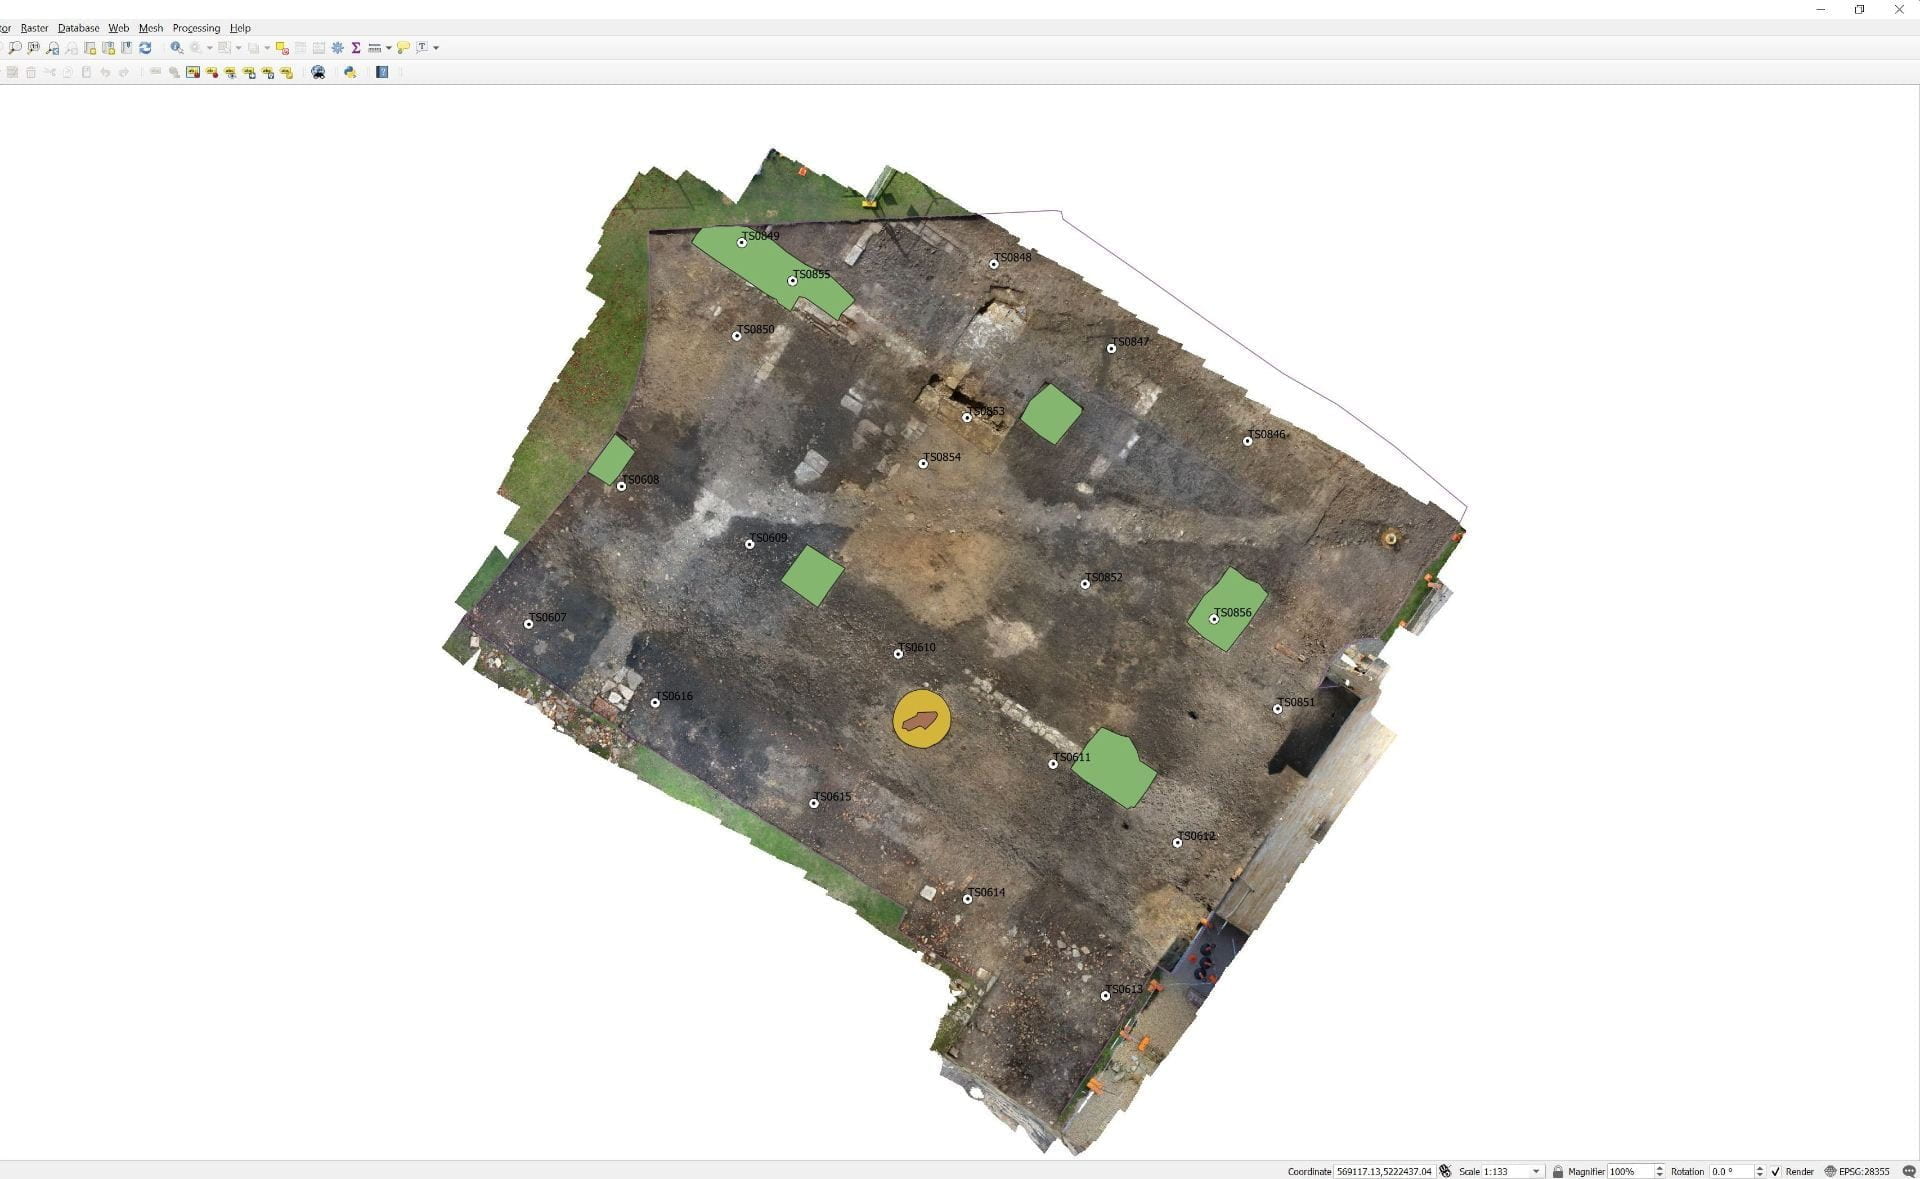
Once aligned, we then can generate a 3D mesh from the thousands of common points that the alignment procedure has selected for us. The image below shows the model as it processes over 370,000 points to make the mesh. The flagged markers are the georeference points that were placed on the site and surveyed using the Total Station. These allow us to reference the final images to the real world coordinates of the site. 
After a bit more processing we are able to produce a highly accurate orthophoto of the site. In the image below, the georeferenced orthophoto has been imported into our GIS system where we have our site survey data. At some future stage I will also use this orthophoto as the reference for the detailed archaeological illustrations. It will also provide a very useful comparison for the site as we excavate down further.
Very cool R. Glad to see you’re keeping out of mischief now the dig is in hiatus! I have been enjoying the updates so glad you still have interesting news to share.
On the plus side, Horus & Boris can now have some privacy to pursue their budding romance.
Brilliant stuff! Thanks for sharing this bit of “behind the scenes” Richard. How deep do you intend to dig, and and what intervals of depth would you take this series of photos again?
Hi Jonathon. It is brilliant, isn’t it! Am I brilliant? Who am I to say. There are no set intervals for photogrammetry – it is driven by what we find. The next big run of photos will likely be taken when we have the demolition overburden removed and nicely exposed all the yards and footings. After that, who knows. As for depth, as much of this site is on reclaimed land, I estimate we only have about 1.0m – 1.5m before we hit the original beach level.