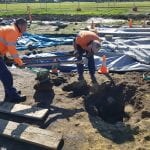
Back in the dim-dark past the sight of an archaeologist clutching a drawing board, bent double over a planning frame or stringline (generally in the pouring rain/high wind) was a common occurrence. Site planning was a fine art, something which I used to enjoy immensely. There was something meditative about planning every stone, brick and patch of crappy dirt and watching a site (or your interpretation) unfold on the page. Back in the safety and comfort of the office, you then got to crack out the drawing pens and permatrace and convert your mud/tear/water-stained creations into works of art. It was actually quite a lot of fun.

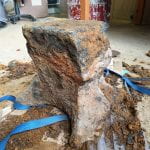
A delightful site somewhere else in the world. Those sticks are planning points. Yes, we had to plan that thing…
These days much of that has been relegated to the mists of time. We still do some drawing on site, usually section drawings to show stratigraphic sequences, or sketch maps to help us understand what the hell is going on. Surveying has partly replaced hand-planning, enabling us to quickly and accurately capture contexts, cuts and structures. Georeferenced photogrammetry takes care of the rest. This generates for us a high resolution orthophoto (basically, like an aerial image) that we can then use as the basis for archaeological illustration and interpretation. The ease with which photogrammetry can be captured and processed means that it has become embedded into the day-to-day workflows of us archaeologists.
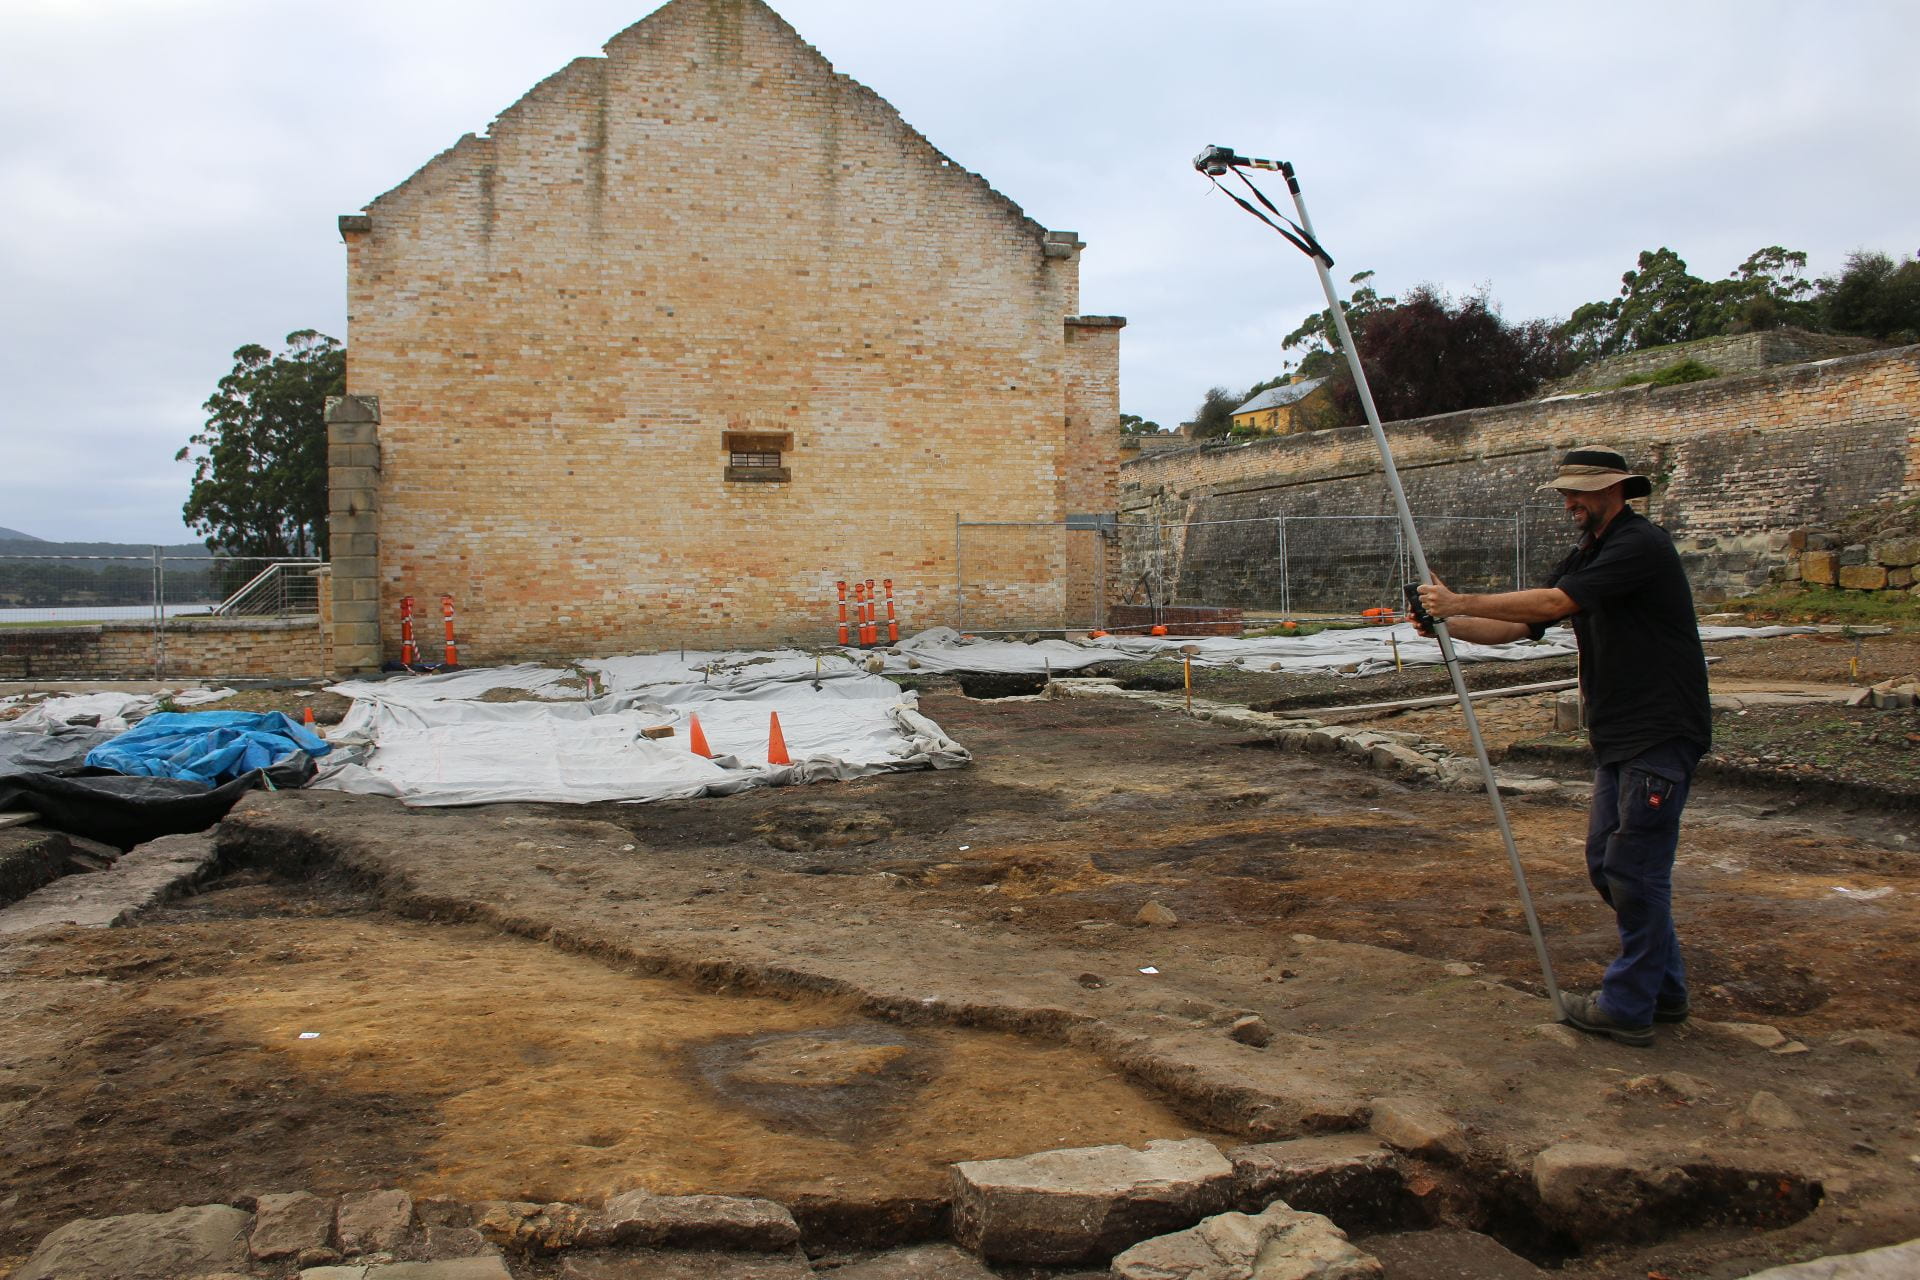
Bend the knees like I told you. The art of photogrammetry recording
There is still a heck of a lot of work that needs to go into the creating the archaeological illustrations that must accompany our reports and interpretations. Each time we do a run of photogrammetry we do a detailed sketch plan which shows the contexts recorded – without this information we would just have a pretty, meaningless picture of the site. This then allows us to piece together the site’s composition and sequence of deposition as we write the report.
The actual work of creating the illustration is done on a computer desktop. My workflow is pretty basic. I import all the georeferenced images into a GIS program (QGIS), then export the whole lot as a layered SVG (this preserves each of the othophotos as an individual layer), this is then imported into an illustration program (Inkscape), where it is scaled and then the orthophotos used as the tracing base for the illustration. I have a set schema of lines, symbols and labels which I use to illustrate the site. The actual tracing is done via a drawing tablet I have attached to my (relatively high-powered) computer.
If you are bored, you can watch me (not in real time) trace some stones…
At the end of the process, I will have turned a confusing array of orthophotos and surveyed lines into a phased representation of the site. So, while I don’t do things with ink pens anymore, I still do some of the fun tracing that I used to do as a chubby-cheeked child all those years ago.
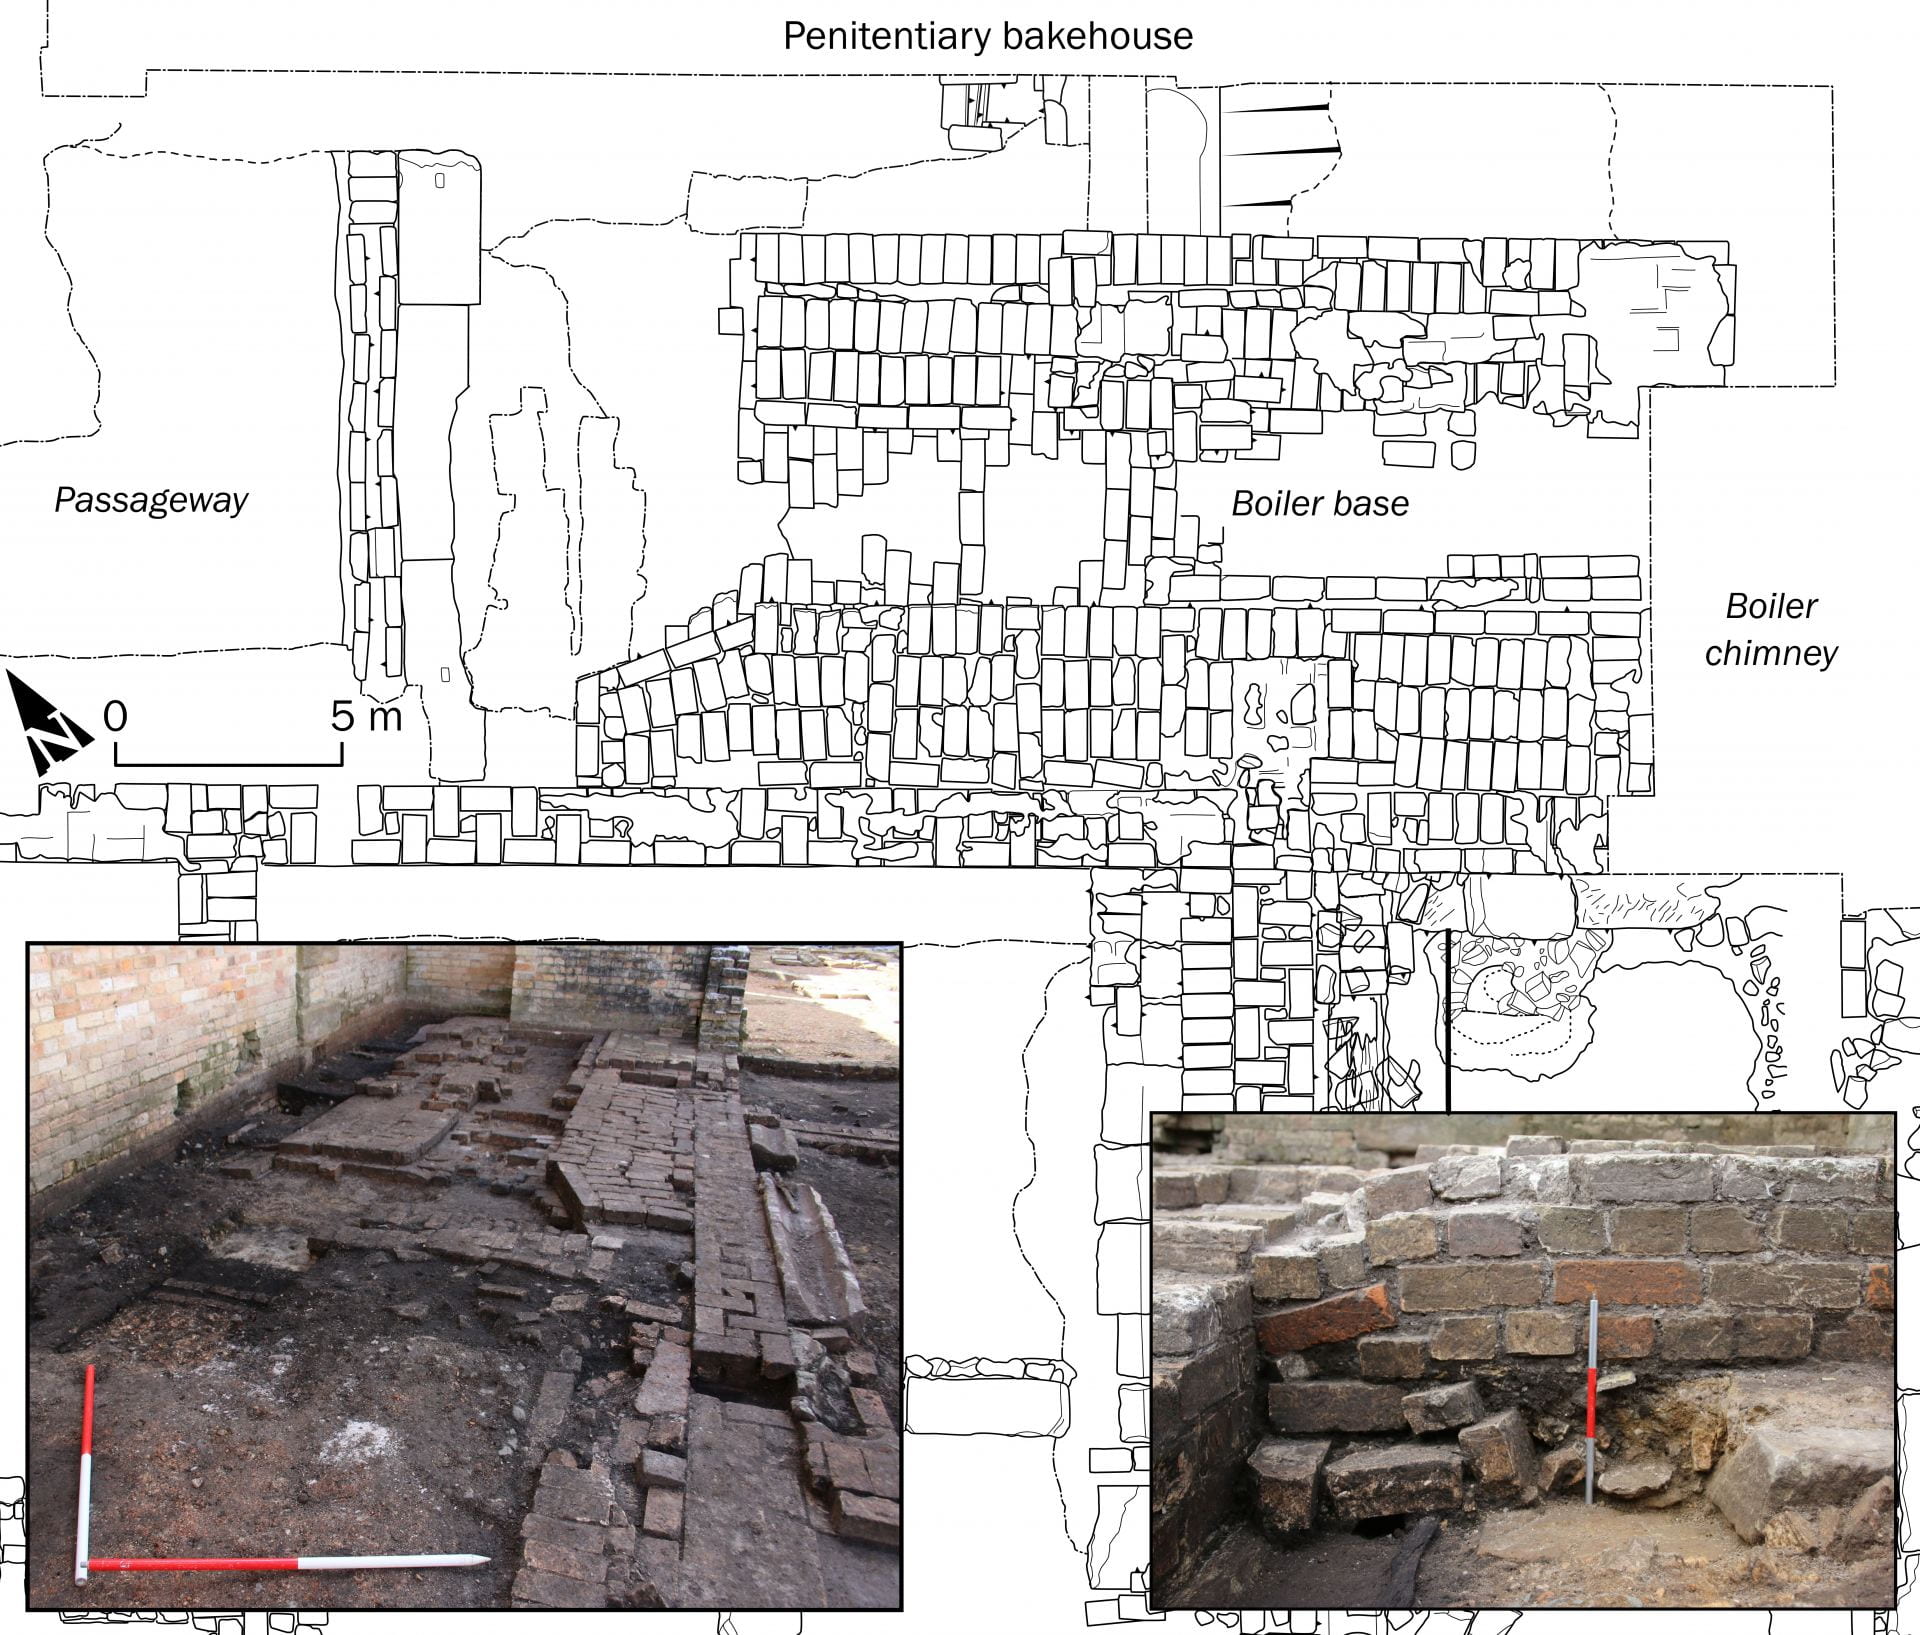
So many bricks. This image is taken from our new book, which you should buy here
Thank you for sharing the process of creating the illustrations that accompany your archaeological reports, Richard. It is really interesting!
You’ll be happy to know that at UNE Martin still teaches “old-school” methods of physically sketching a site and any in situ artifacts. And, from memory, it was a lot of fun, despite trying to sketch in the rain!