
Stories resonate. They provide us with something to identify with, with relevance, with personal connection. They provide us with meaning, and ways of understanding the world. We know from Tversky & Kahneman’s work on cognitive biases (1974), though, that it can be difficult to think beyond the story available in front of us – the most vocal person in the room, an angry colleague or student, the problem that took a lot of time and effort to resolve.
How do we counter that bias? How can we arrive at outcomes that are best for our staff and our students? Drawing on data is essential for evidence-based practice, but data of itself isn’t a solution:
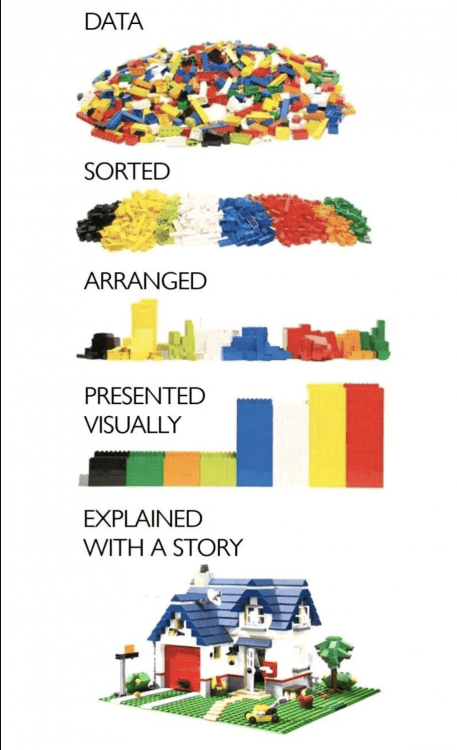
Accessed 16/11/21 from https://ifunny.co/picture/sorted-data-arranged-presented-visually-explained-arranged-with-a-story-vzYLd7Ct8; author unknown
The most effective way to ensure outcomes is combining data and stories – not just the story in front of us or the disconnected, decontextualised data, but understanding the story that all of the available data can tell us. It isn’t about telling a story that misrepresents data, but rather, being able to explain the data in a way that makes it meaningful, and creates a personal connection to the information presented.
The following case studies draw on examples from Education Quality and Digital Education to illustrate how we can drive more effective practice when we connect data and stories.
Empty
Case study 1: Student Attrition – reframing data with stories
When we discuss student attrition, there’s an underlying assumption that we all know that it is bad, and we should be doing something about it. But there’s a difference between hearing about a 33.85% attrition rate and that it’s behind most other universities, and translating that into something that makes a difference. We need to translate this number into a reason for change.
When we start looking at what is behind this number, we start seeing our student stories. For example, our online students are twice as likely to drop out in their first year as our on-campus students. This speaks to the experiences of our online and on-campus student cohorts being incredibly distinct. Given 83% of our student cohort is online, how do we give them an experience tailored to their circumstances that encourages them to continue studying with us? It starts us thinking about a whole range of education and service delivery approaches, such as whether we can provide a universal experience for all students, how we can make our clubs and societies more appealing for online students, and how we help these students feel that they belong to the UNE community.
We can also talk about the incredibly important role of UNE in providing education to students who may not otherwise be able to access higher education. The data tells us that education is transformative in economic, health, and social outcomes for graduates. We play an incredibly important role in building student aspirations and enhancing personal and social outcomes.
But for more than 3 out of every 10 students who start with us, whose aspirations we’ve built, in less than a year of starting with us their aspirations are quickly dashed and they never want to come back. These students don’t speak the language of the university but have grown to believe in themselves and their capabilities through our outreach and the support of their communities. But once they get here, if they don’t get the right support, 3 out of 10 disappear before finishing that first year. They’ve accrued a HECS debt they may spend the next decade paying off, they no longer think they’re good enough to go to university, and they’ve missed out on the positive financial, health, and social benefits of a university education.
In UNE’s Retention and Engagement Plan, we outline that retention and engagement can only be addressed by recognising that everyone has a role to play. The work that each of us do – whether in an online zoom tutorial, supporting students with understanding their fees, providing a welcome call to make students feel like they are a part of the University, ensuring that we have governance to operate appropriately as a university, or ensuring that graduation is a celebration of student achievements – all contribute to whether a student is successful.
And by understanding our students, and the stories that they are telling us through the data, we can start to understand how the solutions may be shaped.
Case study 2: OLX student experience – reframing stories with data
Sometimes, though, stories can get in the way of engaging with data effectively. UNE implemented OLX in 2017, and during 2020 transitioned fully to OLX as our sole model for invigilated assessment. This was a monumental shift – retiring the decades-long practice of paper-based exams and moving to a fully online model wasn’t without its challenges, and represented a significant change to our way of operating. And where there is change, there are stories.
In a high-stakes environment such as an exam, emotions can run high and emotions drive humans to connect through stories. Things like technical difficulties can feel like huge issues and cause significant anxiety, and students naturally seek support and mitigation strategies for these experiences. As humans, we want to empathise with the feelings of those in front of us, but it can be difficult to not apply our experience of that story to our understanding of the phenomenon as a whole, particularly if addressing the issue in question caused us to feel anxious as well.
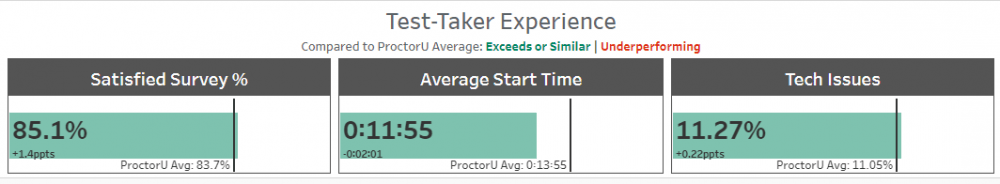
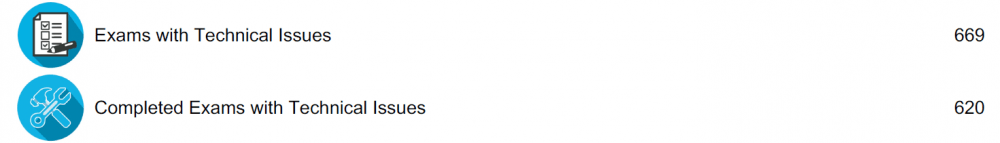
It’s important to be able to acknowledge the role feelings have in biasing our thinking, and to step back and seek out data to frame our understanding of the bigger picture. The below figures show our current period data from ProctorU on the overall student experience of OLX. Looking at the data across the whole student cohort like this tells us that the majority of student have a positive experience with OLX. Our experience survey returns an 85% satisfaction rate and close to 90% of students have no technical issues with OLX – and of those who have technical issues, over 90% are still able to complete their exam. In grading terms, this is a high distinction, and shows that overall OLX is achieving significant success outcomes for UNE.
Finding a balance is key. When we talk about and make decisions about major initiatives like OLX, it’s important to be able to reframe stories with data to work with the bigger picture – each individual story is only a part of the whole and we risk missing out on benefits for the majority if we aren’t listening to the story that all of the data tells. Individual action though, is where stories come back to the forefront – guiding our response to individuals with care and support, and developing meaningful interventions and strategies. Using both in synergy allows us to embed effective practice at scale. For further examples of data in practice in OLX, keep an eye out for The OLX Experience series of posts.
Reference
Tversky, A., & Kahneman, D. (1974). Judgment under uncertainty: Heuristics and biases. science, 185(4157), 1124-1131. https://www.jstor.org/stable/1738360